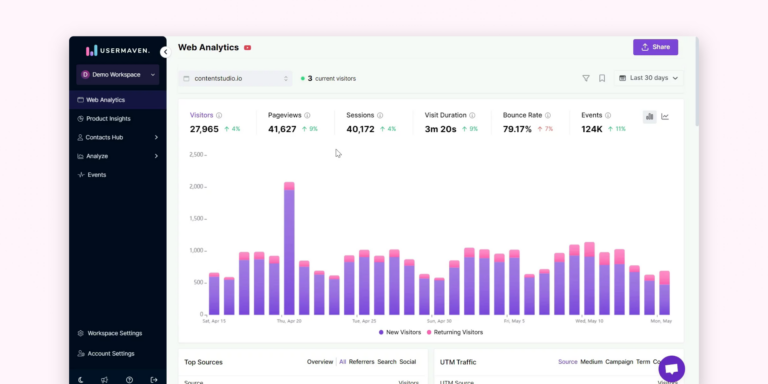
It’s only been a week since Usermaven introduced visitor journeys, and they’re already rolling out another big update. The privacy-friendly, cookieless web and product analytics platform has just announced a […]
Waqar from Usermaven has just announced the release of AI-powered funnel insights, funnel alias, a Bubble.io plugin and more for its privacy-friendly, cookieless and no-code web and product analytics platform. […]
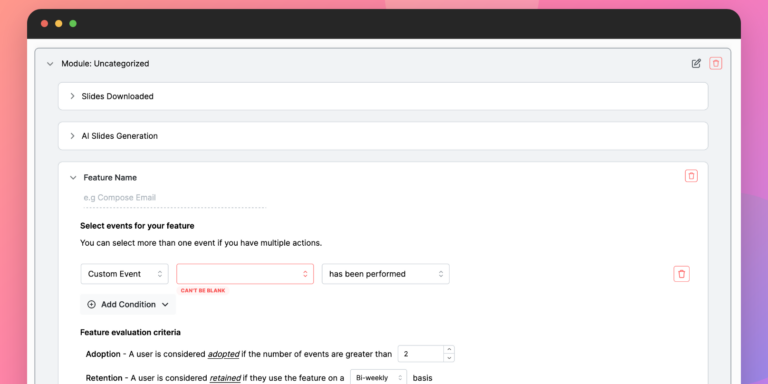
Waqar from Usermaven has just released a new update to its privacy-friendly, cookieless and no-code web and product analytics platform, introducing Feature Adoption 2.0, funnel conversion time distribution, dynamic conversion […]
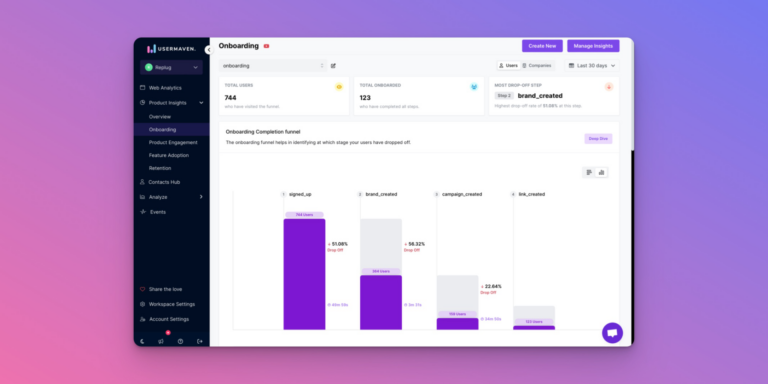
Waqar from Usermaven has just released a new update to its privacy-friendly, cookieless and no-code web and product analytics platform, introducing revamped product onboarding insights, multi-domain filtering, conversion time distribution, […]
Waqar from Usermaven has just announced a new Traffic Exclusion Chrome extension, deeper user insights and an enhanced mobile experience for its privacy-friendly, cookieless and no-code web and product analytics […]
Usermaven has just released yet another update to its privacy-friendly, cookieless web and product analytics platform. Meet segments, revamped funnels, a new docs hub, and more. Segments Segments Segments […]
Waqar from Usermaven has not only launched a revamped website, but also improved workspaces for its privacy-friendly, cookieless and no-code web and product analytics platform. Workspace List View Workspace List […]
Waqar from Usermaven has just launched Analytics Comparison, Contacts Hub 2.0 and a Segment Location Filter for its privacy-friendly, cookieless and no-code web and product analytics platform. Analytics Comparison Usermaven […]
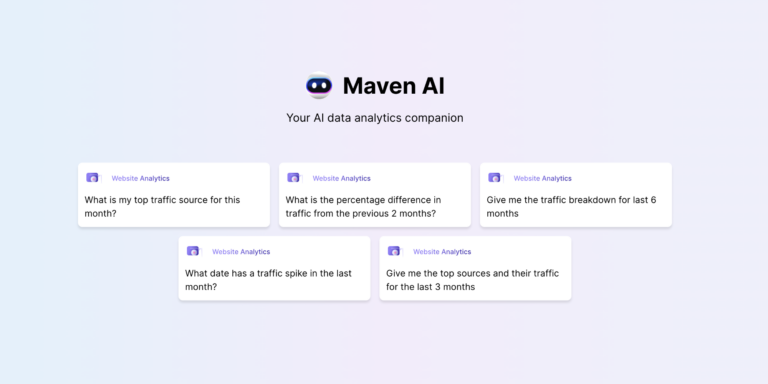
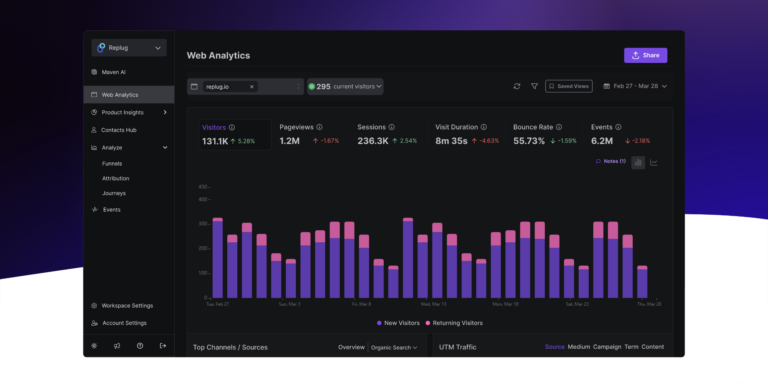
Waqar from Usermaven has just released a polished Maven AI, custom channel mapping, traffic channel filtering and more for its privacy-friendly, cookieless and no-code web and product analytics platform. Refined […]
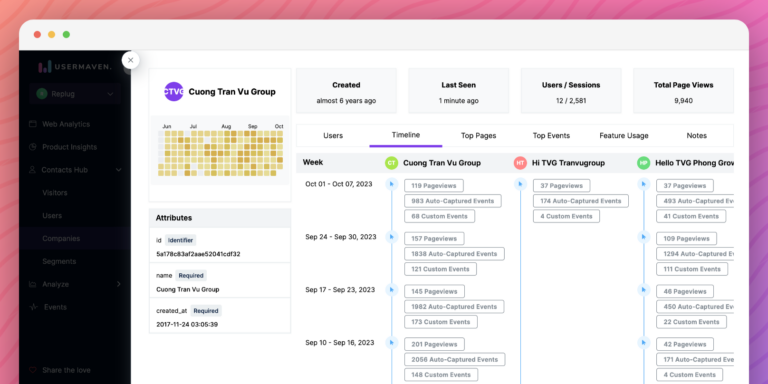
Waqar from Usermaven has just introduced a couple of new features to its privacy-friendly, cookieless and no-code web and product analytics platform. Say hello to a new company timeline view […]