Curated blog with news, events, listings, jobs and exciting stories about web design & web development.
Metorik Launches New Customer Cohort Reports
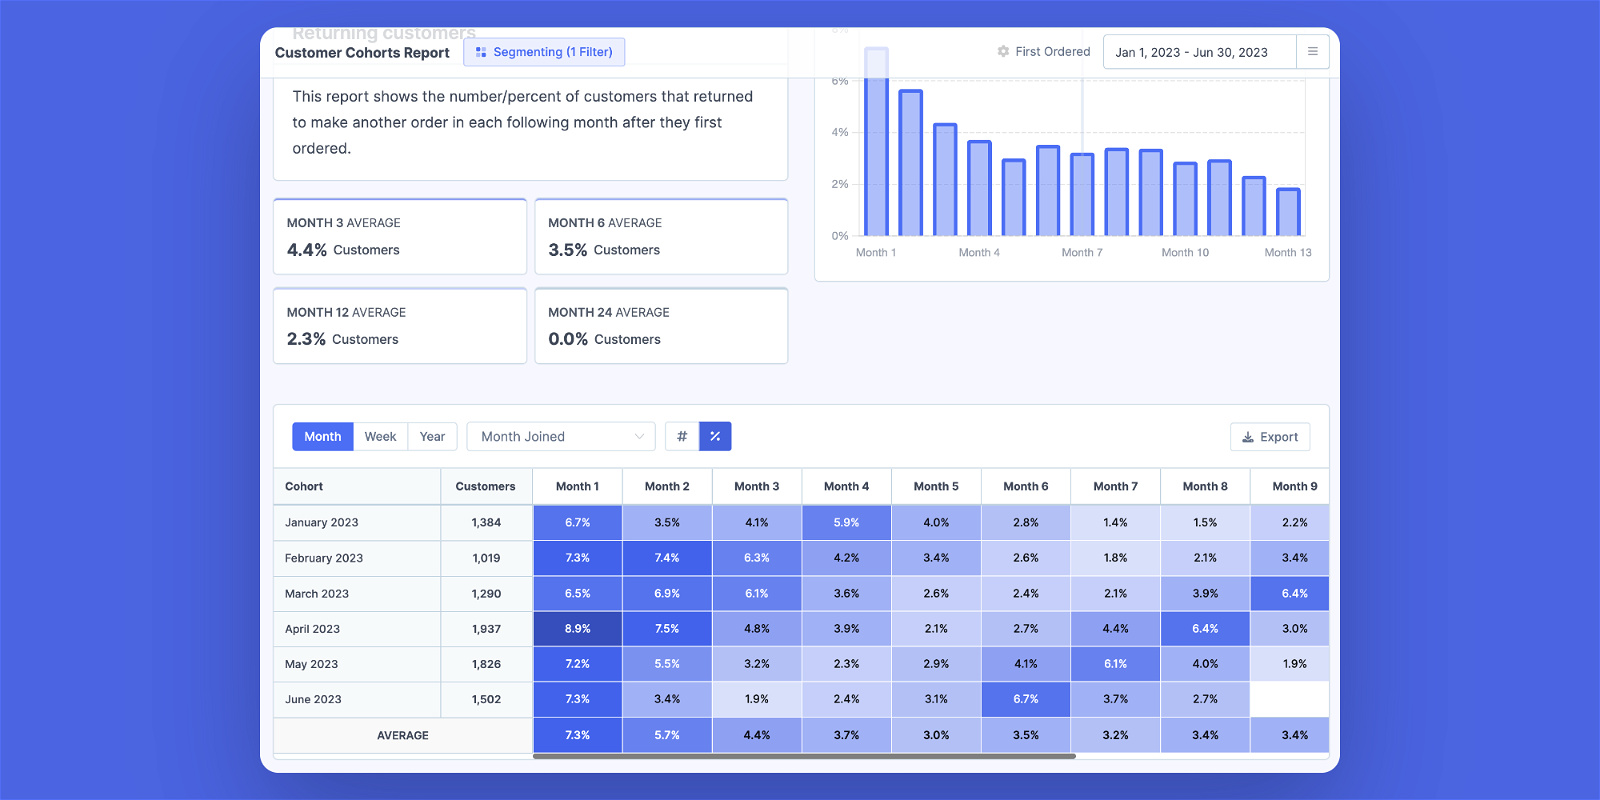
Bryce from Metorik has just announced the first update of 2024 for the ecommerce co-pilot for WooCommerce and Shopify, introducing new customer cohort reports, a card grouped dashboard and more.
Customer Cohort Reports
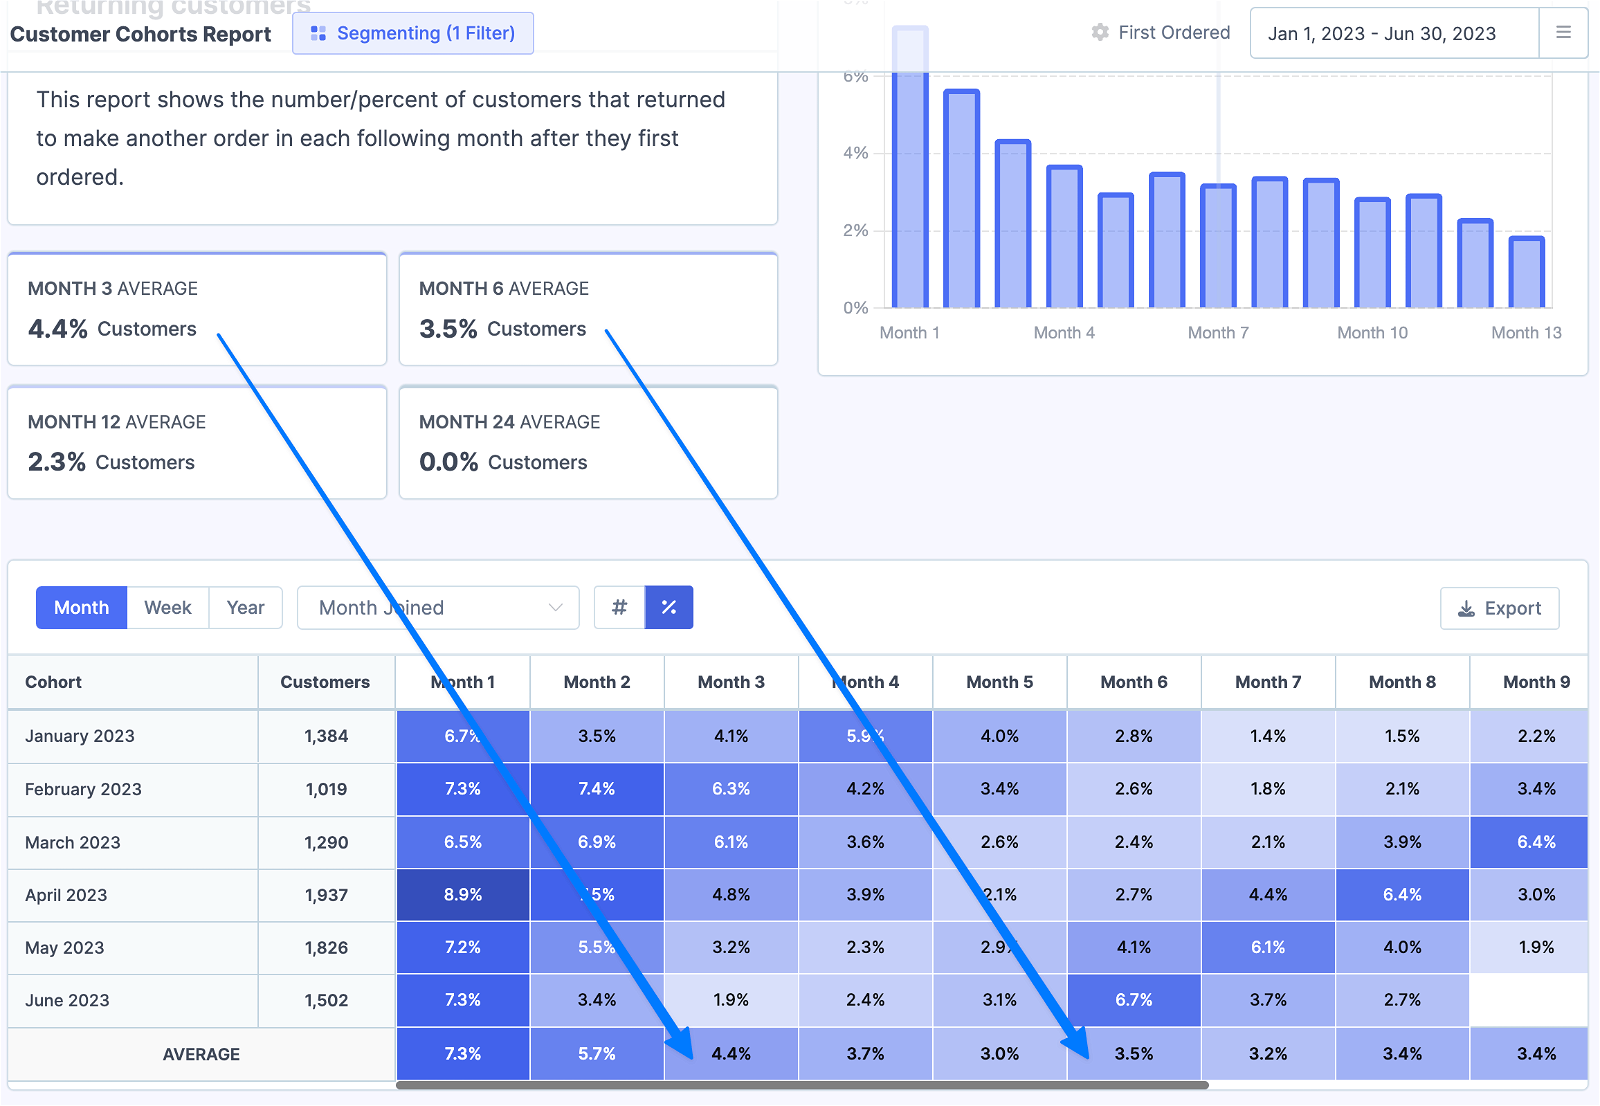
Metorik has launched the new Customer Cohorts feature with 10 different reports, including retention, order count, average LTV, profit over time and more.
You can now view cohorts by first order month, week, year, as well as by customer country, first product purchased and first coupon used. For each cohort you can view monthly, weekly or yearly statistics. You can also export the report to CSV with a single click.
Cohort reports can also be segmented. For example, you can view the entire report for customers from a certain region, by customer role, by categories purchased, by number of subscriptions or 100 other filters.
As usual, if you want to see the customers within each cohort, just click on the customer count and you can instantly view and export the customers within the cohort.
Dashboard Grouped By Reports
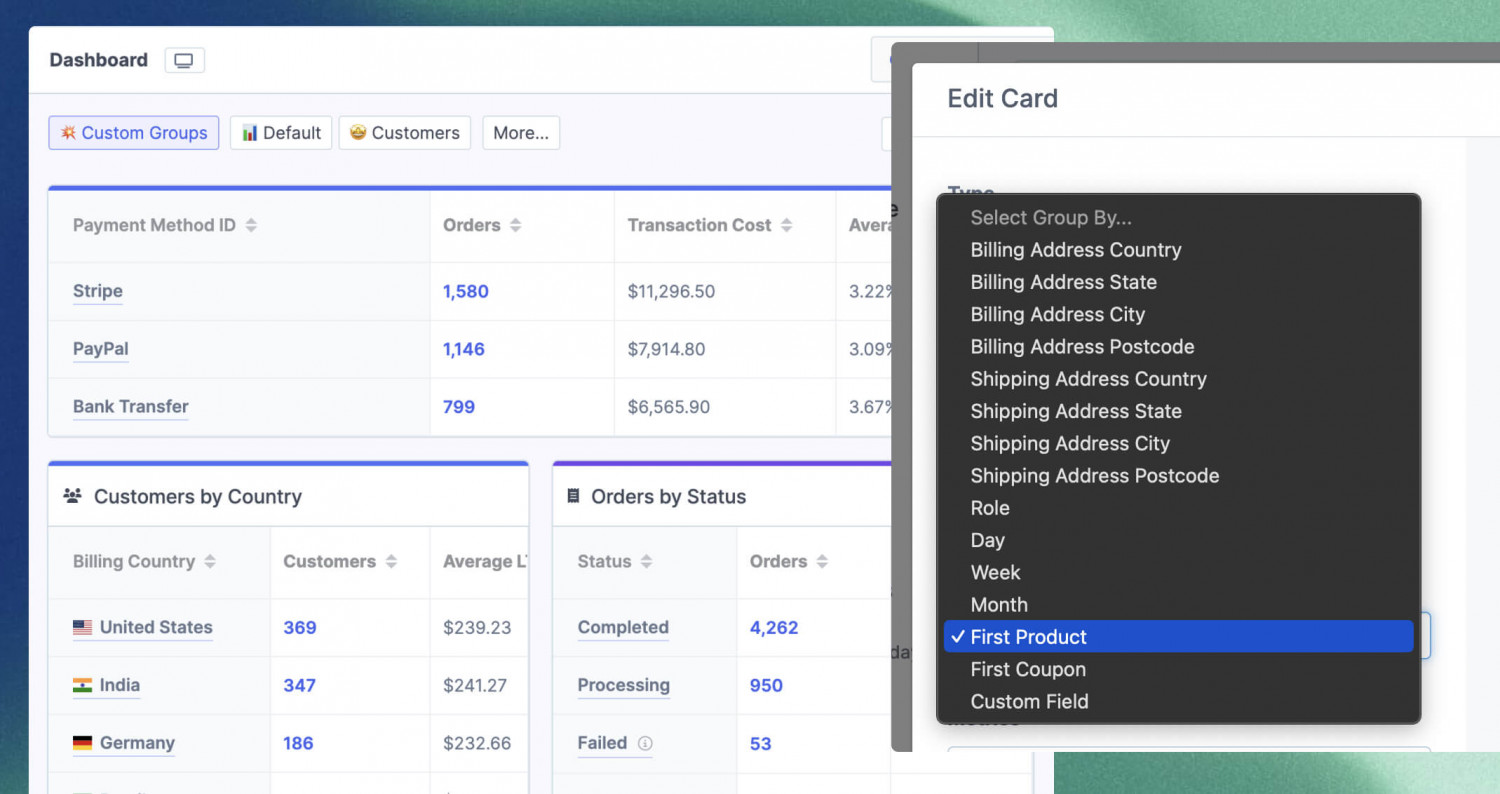
Metorik’s custom dashboard feature puts you in control of how you view your data. Rather than just looking at the reports, custom dashboards give you a tailored view of your business.
The new Grouped by Report Cards feature takes this to the next level. When modifying a dashboard, you can select Grouped By as the card type and then select a report and field to group by. For example, orders and payment method, customers and first product, or even products and brand.
You can add multiple grouped by report cards to a single dashboard, choose whether they take up 1, 2 or 3 columns, and even select the metrics you want to display for each group.
Faster Advertising Cost Syncing
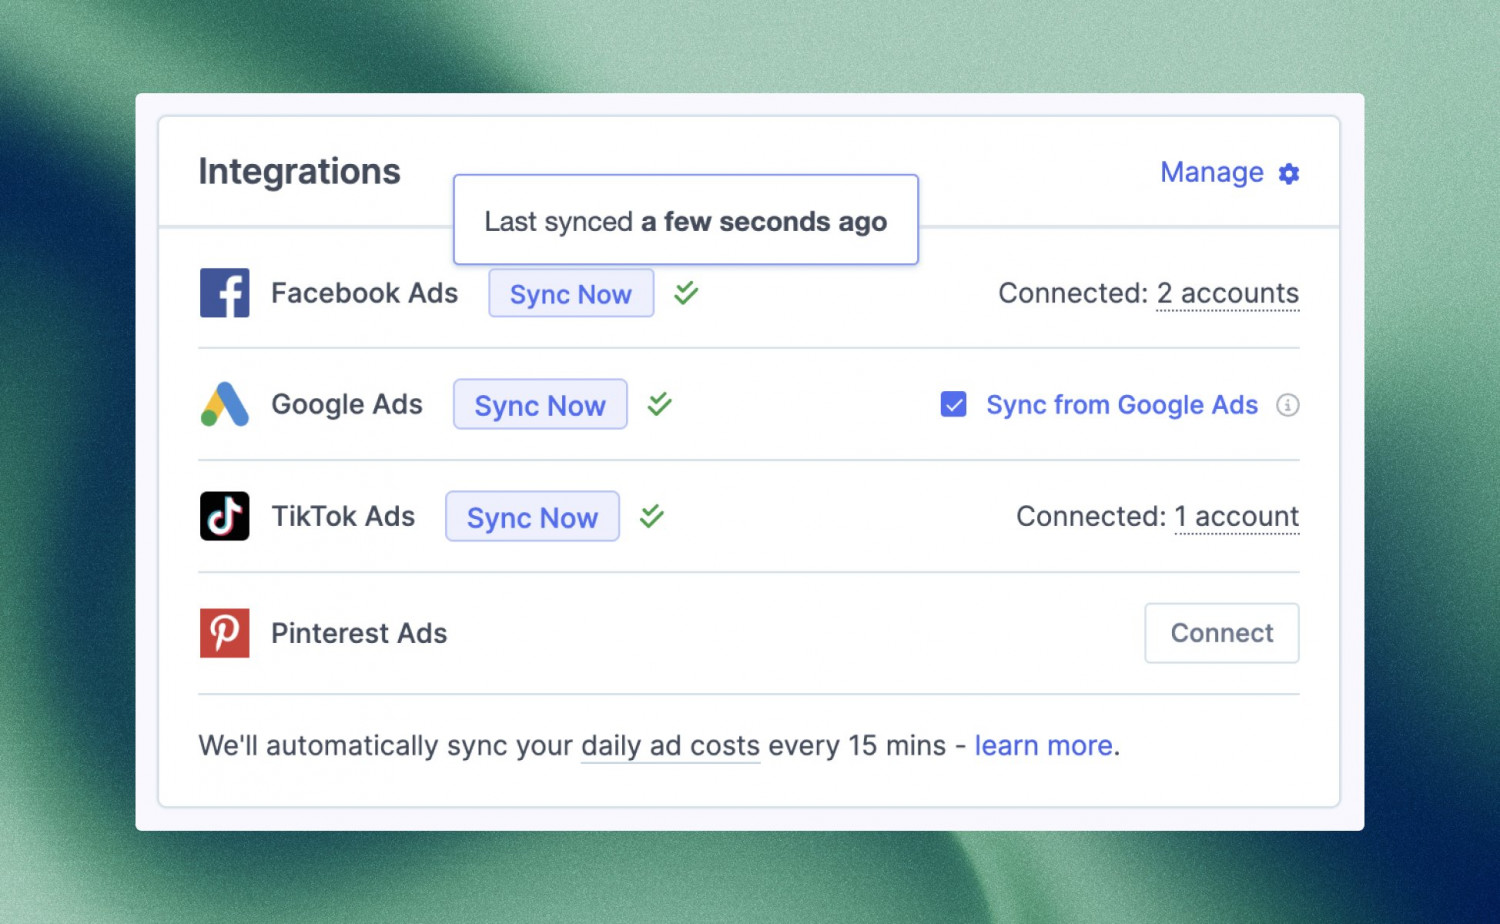
Metorik now syncs advertising costs from Google, Facebook, TikTok and Pinterest ads every 15 minutes, giving you (almost) real-time profit reporting right in the reporting platform.
What’s More?
The Metorik Customer Sources report helps you find out where your customers are coming from. So instead of wondering what to prioritise – social media posts vs newsletters, paid ads vs organic traffic – you can decide by checking which leads to a higher customer LTV.
Now you can also consider the return rate – what percentage of customers return for each source? Channels that lead to returning customers should always be prioritized.
In the coming months, you will be able to subscribe to just Metorik Engage, as it will no longer be just an add-on. You’ll soon be able to use SMS, newsletters and other marketing tools as part of Engage.
Biff Codes - The Job Board for WordPress Devs
Biff.codes is on a mission to revolutionize job boards. Post and find WordPress developer jobs for free.
FTC Disclosure: We may receive a payment in connection with purchases of products or services featured in this post.



Add your first comment to this post